Tech4POD - Equivalent Text Description
Patients Served by the RERC
Brief Description:
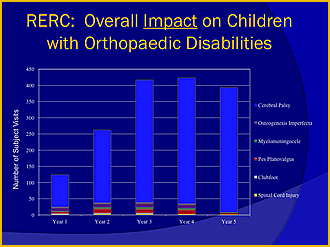
A bar chart titled "RERC: Overall Impact on Children with Orthopaedic Disabilities"
Essential Description:
A bar graph shows the number of children that will be served by the RERC in each year. The bar graphs are broken down by type of disability. The bars are at their highest in years three & four.
Detailed Description:
The bar graph is titled ‘RERC: Overall Impact on Children with Orthopaedic Disabilities. The chart appears to be from a PowerPoint presentation. The y-axis is titled the number of subject visits and the x-axis lists year 1-5.The subdivisions of the bars are different colors: Cerebral Palsy is blue, OsteogenesisImperfecta is purple, Myelomeningocele is green, PesPlanovalgus is red, Clubfoot is white, and Spinal Cord Injury is yellow. A high majority of the number of subject visits are by individuals with Cerebral Palsy over all years. Less than 50 visits have been made by individuals with OsteogenesisImperfecta, Myelomeningocele, PesPlanovalgus, Clubfoot, and Spinal Cord Injury over all years.