Tech4POD - Equivalent Text Description
Trio-pressure measurements for flatfoot
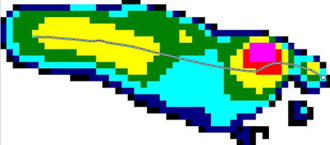
Brief Description:
Schematic shows the pressure distribution of a foot.
Essential Description:
A pressure map of the foot is illustrated using various colors to indicate different amounts of pressure.
Detailed Description:
A schematic image of pressure mapping of a right foot uses varying colors to show different pressure levels. In this image, the least amount of pressure, shown in dark blue, is on the lateral side of the foot, which increases through levels indicated by light blue, green, yellow, red, and pink. Increased pressure is noted on the first toe and in the middle of the heel; the greatest pressure is on the pad of the foot under the first toe. A line transects the foot and follows where the greatest pressure is.